

Posted: November 20, 2026 | Updated: November 20, 2026 at 1:09 PM
Stock on a shelf represents cash a business has locked into inventory. The faster inventory is turned over the quicker cash is recovered. A business’s rate of inventory turnover matters to both a business’s management team and potential investors.
August 2026 data from the federal Census Bureau shows food and beverage retailers on average had stock worth 0.82 months of sales. Building material and garden supply retailers on average had stock worth 2.53 months of sales. In this guide, I explain how to work out inventory turnover. I provide examples and offer suggestions for targets and ways to improve your turnover rate for various retail sectors.

Inventory turnover counts how often a store clears its average stock over a chosen stretch of time. This is typically calculated for one year. If the figure is 8, it means the business sold its stock eight times in a year.
The ratio of inventory turnover uses the cost of the goods you sold (COGS), shown on the income statement, and average stock, shown on the balance sheet. As both elements of the ratio are costs, they are comparable to each other.
Another closely related metric is days sales in inventory, also known as DSI. The formula of DSI is the same as that of turnover, but the result is shown as the days stock waits before it sells. A lower number of days means cash is returned to the business more quickly.
Costco in its 2025 report says its high sales volume and fast stock turnover let it make a profit on thinner gross margins than most retailers.
The inventory turnover formula has 3 steps. First, find average inventory, then take the ratio, and finally find the days.
Average inventory = (Opening inventory + Closing inventory) / 2
Turnover = COGS / Average stock
DSI = 365 / Turnover
Keep the time period the same for each entry. For each entry, average stock for the year should be paired with COGS for that year. Average costs for a quarter should not be paired with average stock for a year.
This can be illustrated with Costco’s fiscal 2025 figures. Costco reported merchandise costs for the year ended August 31, 2025 of $239,886 million. Costco’s merchandise inventories as of September 1, 2024 were $18,647 million and as of August 31, 2025 were $18,116 million.
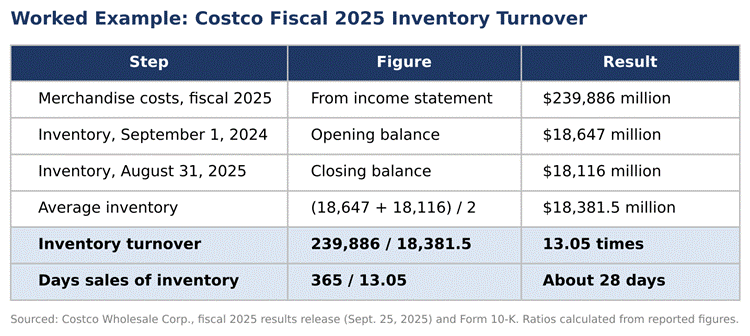
Average inventory is $18,381.5 million. Costs divided by this figure come to 13.05. Thus, on average, Costco sold its stock 13 times in a year. Dividing 365 by 13.05 shows the average stock on hand is about 28 days.
Using these same calculations, a small shop with $300,000 in COGS and $50,000 average stock would turn its stock 6 times. This means stock on average is held 61 days before selling.
No single number is right for all businesses. Grocery stores need to turn over their inventory in days. Furniture and lumber can last years. Customers expect a wide variety in furniture for sale on the floor.
The Census Bureau publishes this gap each month. Their measure is called the retail stock-to-sales figure. This metric divides a business’s month-end inventory by the sales for that month. When this number is low, inventory would not cover the business’s sales for very long.
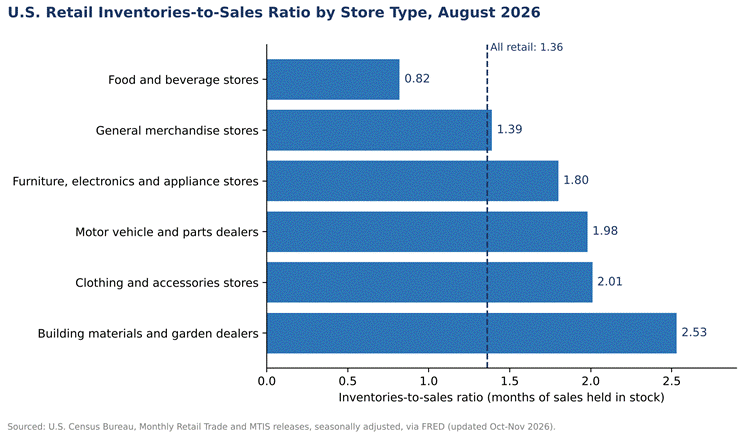
Clothing stores had a 2.01 month supply of inventory on hand in August 2026, according to the seasonally adjusted series. General merchandise stores had an average of 1.39 months of inventory on hand, about the same as the all retail average of 1.36 months. Keep in mind one important constraint. The Census ratio measures inventory against sales at selling prices; turnover uses costs. Treat the Census ratio more as an industry comparison than as an absolute target.
The best comparison is against yourself and against similar businesses. The Business Development Bank of Canada has a free online service that enables businesses to compare their turnover against their peers.
More turnover does not necessarily mean better turnover. A high turnover ratio may mean that items are selling out and not being restocked, thus leading to lost sales. In the case of very low stock levels, transportation costs may increase, and discounts may be forfeited. The objective of an optimal turnover ratio is to ensure that there is sufficient stock of items with the greatest demand without tying up extra cash in inventory.
Turnover drops when stock increases faster than sales. This is typically the case when sales slow down and orders continue to come in. There are different reasons for why this may happen. Buying large lots to get a discount from the supplier or holding on to items that have not sold for months are some reasons for reduced turnover.
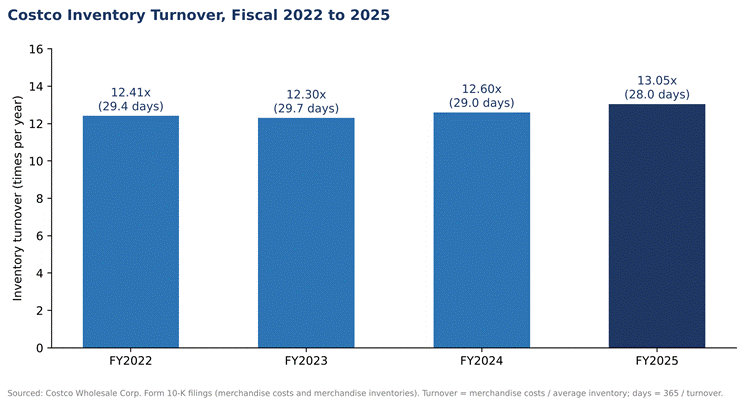
Large chains experience this also. Costco’s merchandise inventories increased to $17.907 billion in 2022 from $14.215 billion in 2021, as reported in their filings. Their turnover rate for 2022 was 12.41 as compared to 13.05 in 2025.
Store average can mask problems as well. AccountingCoach, an accountant training site, has an example of a situation in which the average for the entire store was calculated to be a 72-day turn, while most items averaged 109 days and the fast sellers turned every 18 days. One solution is to calculate the average for each product category. This would indicate which items are slow-moving.
Inaccurate data can also cause artificially low ratios. Items that have been received but not entered into the system or damaged items that are still showing on the books inflate the average stock value. In effect, the math indicates the average items are moving slower than they really are.
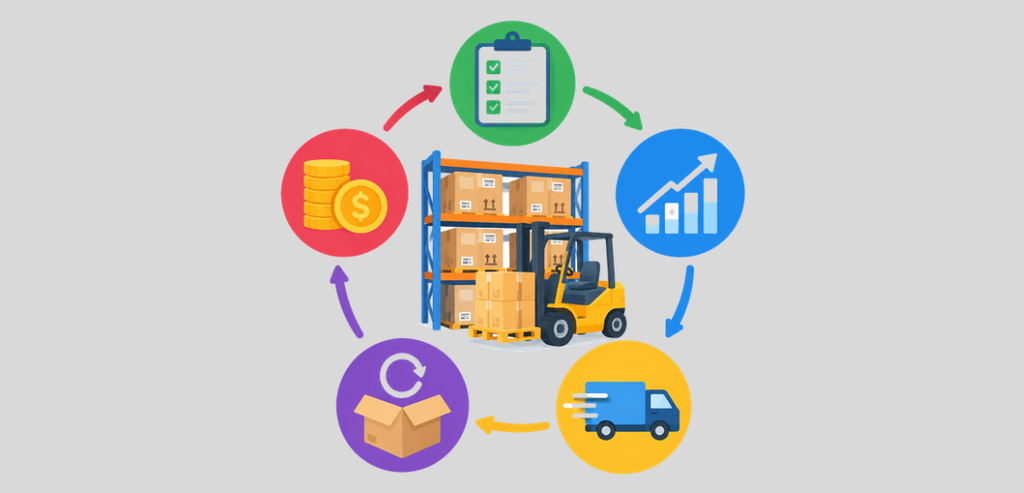
Buy Smaller Batches More Frequently
Reducing the average amount of stock carried in the store, without affecting the total number of sales, is easier if purchases are made in smaller lots. Find out what the minimum order size is for each of your suppliers and see if there are ways to free up cash by passing up bulk discounts. Ask suppliers when they can deliver.
Clear Slow Stock
Put an expiration date on slow-moving stock. After that date, either mark it down or sell it with more popular items. Old stock will rarely increase in popularity.
Replenish Based on Actual Sales
Your trigger level for reordering should be based on how quickly an item sells and how long it takes your supplier to fulfill an order. Demand can change over time, so this trigger level should be evaluated and adjusted seasonally.
Reduce the Number of Items You Carry
Oftentimes various versions of the same item are offered on the same shelf. Eliminating the less popular versions can increase the average velocity of the items carried.
Reduce Lead Times
Work with your suppliers to see if they can improve their lead times. Also ask if they would be willing to ship items more quickly, or take consignment inventory for new items you wish to carry.
Reports that most likely contain the information you need already exist in your point of sale system. Look for the reports for COGS over the period, inventory value at cost on the opening date, and inventory value at cost on the closing date.
It may also be helpful to calculate the ratio by item, or by category. To do this, identify the slowest-selling items by determining the average number of days each item is on hand.
For a one-month ratio, divide 30 by the result to get DSI. Multiply a one-month ratio by 12 for a rough yearly figure. Maintain consistency in the method you use to calculate so you can track trends.
Trend each category against itself to identify emerging opportunities. Identify gaps in the system before they impact the inventory ratio by using cycle counts.
Always record errors in shipments, i.e. lost or damaged shipments, to avoid discrepancies in the system.
Inventory turnover tells you how often your stock has been cleared and restocked over a chosen period. To work it out, divide COGS by your mean stock level. You can also express this as the number of days stock sits before it sells.
Costco’s filings show they turned their inventory 13 times in fiscal 2025. Census data shows variations by type of business. Compare your ratio to other years and to similar businesses. Take action to sell slow-moving stock before it gets outdated.
It shows how often a business clears out and restocks its average stock over a chosen period, typically a year.
Divide COGS by mean stock held over that same span. Average inventory is the mean of the opening and closing inventory for that period.
Not always. A very high figure may mean you lost sales due to stockouts. The appropriate level varies with different products and terms from your suppliers.
Most businesses assess it on an annual basis. However, some businesses may wish to assess turnover more frequently, depending on the nature of their products and the level of variability in demand for those products.
Reduce Your Fees, Upgrade Your Service.
Your information will not be distributed
We received your request. A payments specialist will reach out shortly.
