
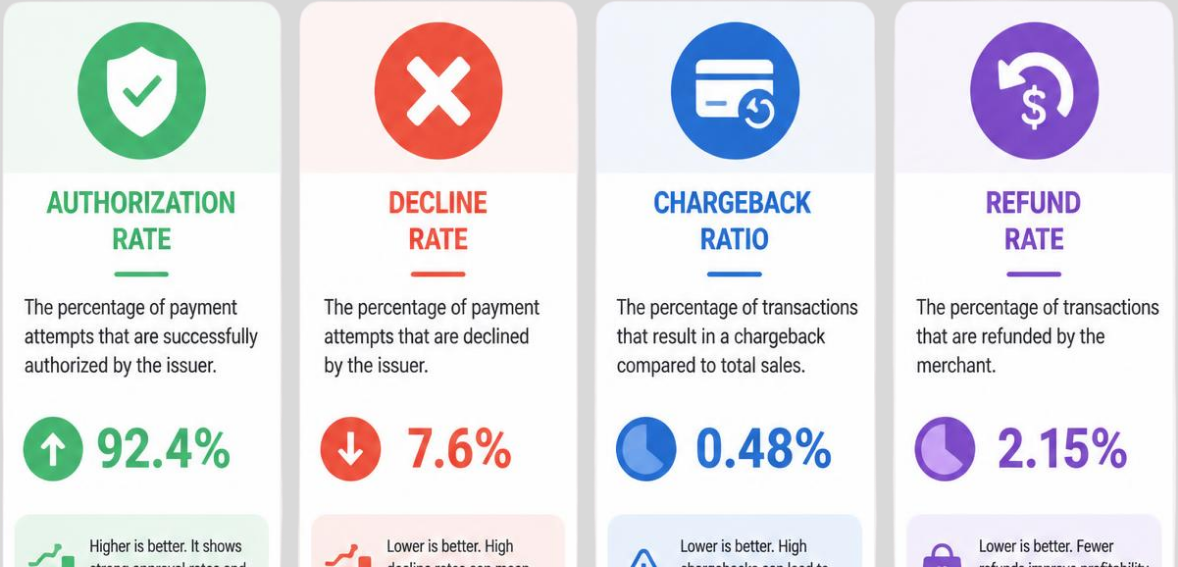
Each of the four ways that a payment transaction can fail provides an indication about your business. For example, one merchant processes 96% of attempts, but loses money on all of the refunds. Another processes just 84% of attempts and has an unblemished record during disputes. Neither of these cases could be analyzed by just looking at a “success rate.” These cases would become apparent when we analyze and look at the authorization rate, chargeback ratio, and refund and decline rates, individually.
These four rates are the core health metrics of a payments operation. Each of these four separate metrics can be influenced by a number of different factors and therefore can be changed independently. This guide explores these metrics in further detail and will help the reader understand how each metric can be specifically influenced rather than ‘guessed.’ A complete payment health check takes approximately 30 minutes.
From each transaction, there are four contingencies to be aware of. A transaction can be authorized, declined, disputed, or a refund can be requested. Each of the four contingencies have their own associated metric. An interesting fact about the sheet is that all of the metrics have differing questions that they answer.
The metric for an authorization would answer if the transaction was processed. With a metric for declines, we can answer the reason it was declined and whether the reason was something that we can fix. For the metric of chargebacks, we are concerned about the customer taking his/her unresolved dispute to his/her bank. The metric for refunds is concerned with the customer returning the merchandise and requesting the refund.
An example can illustrate the point. A merchant can have a high overall approval rate, but if the reason for declines or the chargebacks were to increase, then he is losing money. Conversely, a merchant with great overall ratios can still end up in a chargeback monitoring program. You would never know what is going on if these metrics were grouped. A blended metric hides the most important information.
Authorization rate is the fraction of attempted transactions that the card issuer approves. To calculate, divide the approved transactions by the total attempted transactions, and multiply by 100. The term “attempted” is important. This includes every swipe, tap, and click to check out, not just the successful transactions, because the low number that is the denominator hides declines and gives an illusion of a high approval rate.
There are structural differences for approval rates for card present transactions versus card not present transactions, and the difference is not a performance issue, but rather how the systems are built. In a card present transaction, the card and chip, as well as a PIN, give the issuer a reasonable belief that the cardholder is present. For card not present transactions, by default, none of these are present, so the issuing bank declines more transactions and has more of a cautious approach. This is especially true if there are no additional safeguards that are provided by network tokenization or 3D Secure.
For E-commerce transactions, the normal range for approval rates would be in the 85% to 92% range. For card present transactions that are domestic, the normal range is in the mid-to-high 90% range. There are a variety of tokenized wallet services that consumers can use for card not present transactions that are provided by a card network. These services have trust techniques built-in and as a result, approval rates for these transactions can improve to the 92% to 97% range.
These are typical ranges and not rigid qualitative factors. The quality of the ranges depends on the type of industry, the region, and the sort of controls that are in place for detection of fraud. The following chart illustrates the most frequent types of channels that are compared for approvals.
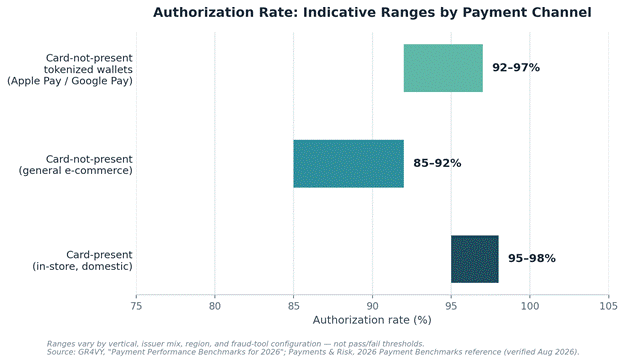
Figure 1. Authorization rate indicative ranges by payment channel. Ranges differ by vertical, issuer mix, region, and configuration of the fraud tool. Source: GR4VY, Payment Performance Benchmarks for 2026; Payments & Risk 2026 benchmark reference.
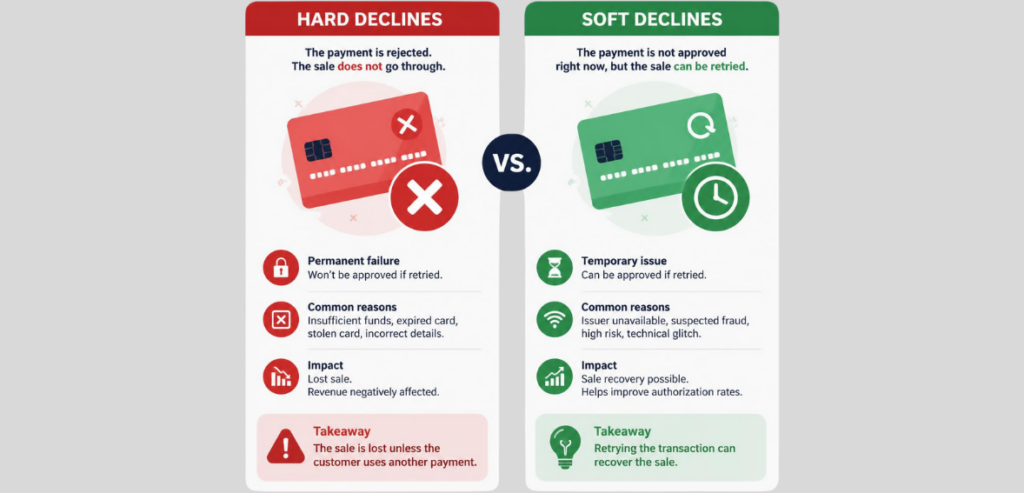
The decline rate is calculated using the same formula as the authorization rate with one exception, which is that decline rate gives a measure of how many attempts were declined. The total number of attempts is not as important as the breakdown that occurs below it. Authorization of a transaction is declined for many reasons. Hard declines are permanent declines, which means the card has either been reported lost or stolen (or closed by the cardholder) and will not be authorized even if the transaction is resubmitted.
It is a waste of processing resources to resubmit a transaction that has been hard declined, and in some cases, excessive retrying of a transaction can result in penalties assessed to the merchant by the transaction processing network. In these situations, the best course of action is to ask the customer for a different payment method.
Soft declines are typically the result of momentary issues that make the approval of the transaction impossible. Soft declines are far more common than hard declines. Soft declines are typically caused by insufficient funds, timeouts in the issuing bank’s system, velocity limits, risk flags, or issuing banks that are requesting more verification depending on the risk associated with the transaction.
Because soft declines are so common, the implementation of a retry strategy makes sense. The recovery of soft declines is frequency-dependent, and many merchants have reported recovery of soft declines in the range of 20%-40%. This recovery rate is particularly focused on recurring billing transactions.
Retries should be spaced out, typically three to five attempts over a 10–14 day window. If the decline reason is a soft decline, a retry should be initiated. However, if the decline reason is a hard decline, then the merchant should move on to the next payment processing method. These are the exceptions to the general strategy.
The ratio of chargebacks to transactions (chargeback ratio) is used to evaluate the potential risk in a transaction. However, ‘chargeback ratio’ is not a singular metric. Visa and Mastercard use their own methods for calculating chargeback ratios, include them on different transaction types, and use different cutoff values. Merchants must understand both methods because a merchant can pass one network’s standards and fail the other.
Visa simplified multiple fraud and dispute management services by integrating them into a new offering called the Visa Acquirer Monitoring Program (VAMP). The VAMP ratio combines monthly fraud reports and disputes, and is then divided by the number of settled transactions for the month. VAMP calculates on a monthly basis, which aids prompt response to changes in the market.
The “Excessive” ratio threshold for North America, the EU, and the Asia Pacific was lowered from 2.2% to 1.5% effective April 1, 2026. Violation of this ratio will result in enforcement of per-dispute fees on both merchant and acquirer accounts from Visa after a grace period. With VAMP, since fraud ultimately leads to chargebacks, transactions are counted twice. As a result, in many cases, the ratio can move unexpectedly fast for merchants.

While other programs utilize previous chargeback totals or previous months of sales, Mastercard Excessive Chargeback Merchant Program (ECM) divides the current month’s chargebacks by the previous month’s transactions. The one-month lag means a slow sales month can increase the ratio for the following month even though the actual number of disputes have not changed.
Mastercard considers a merchant to have an excessive chargeback ratio at 1.5% and 100-299 chargebacks in a month; both conditions must be met. At 3.0% and 300 chargebacks in a month, the merchant is considered a High Excessive Chargeback Merchant and would be charged higher monthly fees. A merchant must have 3 consecutive months that meet program requirements to exit the program and reset the status.
One bad month means more than just the raw number of chargebacks, because both networks look at consecutive-month patterns, and a single spike can increase the ratio for the current month even though the surrounding months have been clean. This is why the chargeback ratio should be a standalone metric, rather than being part of a ‘customer satisfaction’ metric.
The refund rate indicates how much of a merchant’s transactions, or dollars in that merchant’s transactions, are voluntarily refunded to the customer, either in full or in part. It is calculated by dividing refund transactions by total transactions for the same period. Refund rate must be tracked independently of chargebacks because in a refund, the customer has come to the merchant for a refund, whereas in a chargeback, the customer has gone to the bank around the merchant.
What is considered “normal” is highly subjective dependent on the business model. For subscription and services, refund rates are usually in the low single digits. In the case of physical goods, e-commerce tends to have higher refund rates and in the case of apparel, refund rates tend to be higher due to the nature of returns due to fit and sizing issues that are unrelated to payment issues. In this case, there is no single healthy rate. The correct comparison is the merchant’s own trend over time, segmented per product category, not an industry average.
The true value of a refund rate is that it is a leading indicator. What is seen from an increasing refund rate today is that, in 6 – 8 weeks customers who requested a refund and were not successful, or who did not think of it, will take it upon themselves to go to their card issuer. Tracking refund rate is a significantly less expensive way to detect a product, fulfillment, or service issue before it impacts the merchant’s compliance with the network.
The four metrics give a fuller picture when read as a unified scorecard over time. Three months are illustrated below. The numbers are for demonstration and are neither benchmarks nor data for real merchants.
The hypothetical merchant in Month 1 has a fairly standard card-not-present situation with a 91% authorization rate and a 9% decline rate, a 0.35% chargeback ratio, and a 3.5% refund rate. Month 2 shows a processor-related setting that has caused address verification to be done too aggressively. As a result of this configuration, the authorization rate dropped to 84% and the decline rate increased to 16%. The refund rate also increased to 4.8%. Customers have run into fulfillment issues connected to the same address verification problem. The chargeback ratio moved very little and currently stands at 0.55% as chargeback disputes take a considerable amount of time to surface.
In Month 3, the address verification setting was fixed and the authorization rate improved to 90% and the decline rate fell to 10%. Still, the chargeback ratio increased to 0.9% as the disputes from the previous Month 2 configuration are just beginning to surface. The chargeback ratio is a lagging indicator and is normally 4-8 weeks old when it changes. This is why a merchant needs to monitor real time refund rate and decline rate, rather than waiting for the dispute to surface.
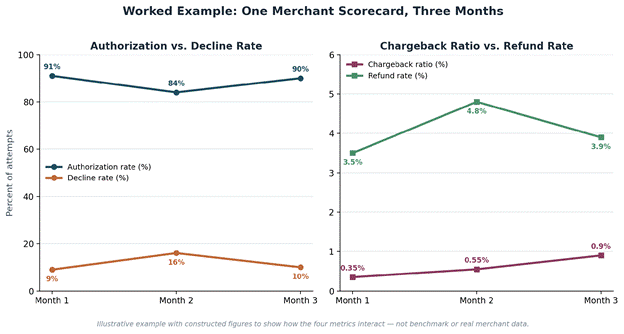
Figure 2: Example of merchant scorecard for three months. Comparison of relationship of authorization, decline, chargeback, and refund rates. Constructed example for demonstration. Not benchmark data.
The four separated metrics take the guesswork out of solutions. Each of the metrics responds to a specific operational lever, and applying the wrong lever to a metric is a waste of time and effort since it won’t impact the number. Below is a table with the most common cause behind each metric and the corresponding solution.
| Metric | Common Cause | Primary Fix |
| Authorization rate | Weak issuer trust signals on card-not-present traffic | Network tokenization, 3D Secure, and smart routing across processors |
| Decline rate (soft) | Temporary issuer or processor conditions | Scheduled retry logic, three to five attempts over 10–14 days |
| Decline rate (hard) | Invalid, closed, or restricted card | Immediate customer outreach for a new payment method; stop retrying |
| Chargeback ratio | Unclear billing descriptors, slow refund handling, friendly fraud | Descriptor clarity, faster refund turnaround, Visa/Mastercard dispute-alert tools |
| Refund rate | Product mismatch, fulfillment delay, unclear return policy | Fulfillment audit, clearer product listings, proactive customer communication |
A monthly review only requires data team involvement to the extent of pulling five numbers that take approximately 30 minutes to read. Authorization rate, split by card-present and card-not-present transactions, is the first of the five numbers. Next, determine the hard versus soft split of the decline rate. An increase in hard declines can suggest an old card on file that requires an account updater. Next, determine the chargeback ratio for both Visa and Mastercard, as they tend to differ, and review the ratio for the last two months, not just the current month. Lastly, review the refund rate by category to see if there is an individual category with an unusually high refund rate.
This type of review should take approximately 30 minutes and should provide a list of the changes that were observed, the likely reason they occurred, and the most appropriate lever to address the changes. This type of review, done monthly, can convert what is typically quarterly reporting into a type of forward-looking analysis.
HMS Pay makes it easier for monthly reviews, as authorization, decline, chargeback, and refund reporting can be accessed by merchants from a single merchant dashboard. This eliminates the need for the merchant to view these reports from different processors. For merchants having multiple MIDs or legal entities, the drag-and-drop functionality makes the monthly review an actual thirty-minute review, whereas it previously needed to be done every month but was sometimes ignored when things got busy.
Four metrics track the success of a payments operation: authorization, chargebacks, refunds, and decline rate. However, the metrics for a given merchant do not correlate to the metrics of another merchant. A merchant can have high authorization coupled with a high chargeback rate, while another merchant can have high authorization coupled with a high decline rate.
Analyzing the metrics as a single blended health score provides little insight to a merchant on the cause of the issue. Instead, they should track the metrics individually and analyze the movement of each metric independently of the other. Once problems are identified, each merchant is responsible for determining the fix. Too often, merchants identify fulfillment issues three months after the problems began, rather than two weeks after.
The authorization rates vary based on the channel. Domestic, card-present transactions tend to authorize in the mid to high 90s, while card-not-present, e-commerce transactions tend to be between 85 and 92 percent. Instead of looking for one target, see how your authorization rates have changed over time.
A payment is declined if money does not move and the card issuer refuses to process the transaction. If money has moved to complete a transaction, and the cardholder files a claim to get the money back with their card issuer, a chargeback occurs.
Visa calculates the chargeback and dispute ratio for the month by the number of transactions for the month. Mastercard calculates the ratio for the month by transactions for the previous month.
Having a physical POS in-store helps verify the presence of the customer. Without additional verification like tokenization or 3D Secure, online transactions are processed with higher risk.
Check payment metrics at least monthly. Authorization and decline rate should be checked more frequently. Check chargeback ratio for at least the previous two months.