
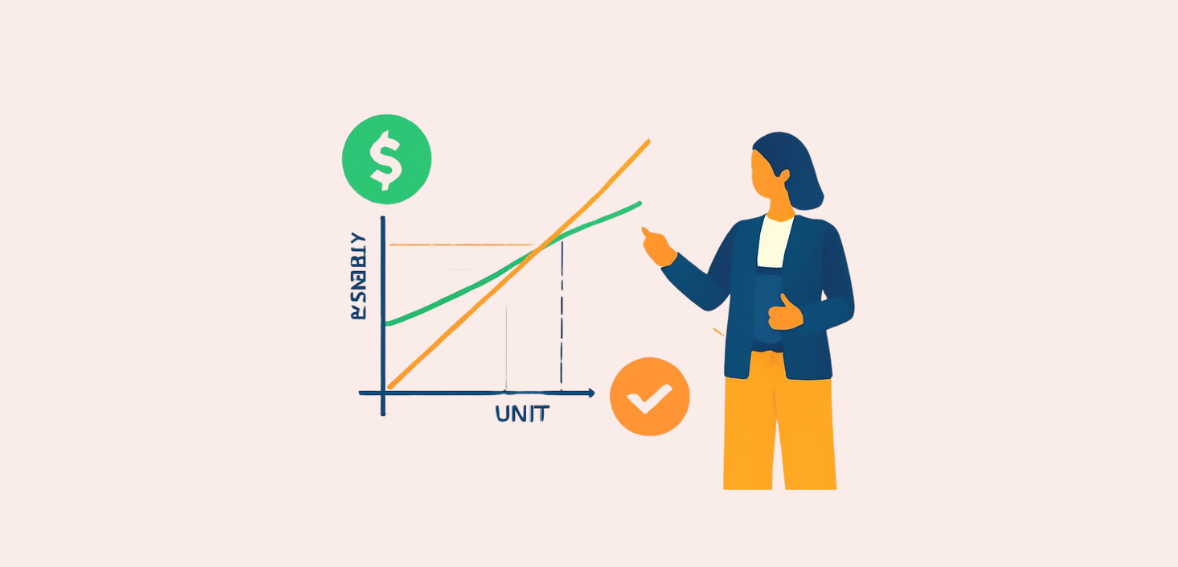
Each business owner asks the same question at least once. At what point do I stop losing money? The answer is not ambiguous. This is known as the break-even point. A break-even analysis is the answer to this common question. It explains when your revenues equal your expenses. Knowing this number makes the loan process, budgeting, and forecasting easier to navigate and predict.
Everything you need to know about break-even analysis is explained in this guide. You will discover the break-even point equation, the difference between fixed and variable costs, and the importance of the contribution margin. After reading the guide, you will be able to find the break-even point in dollars and units for your company.
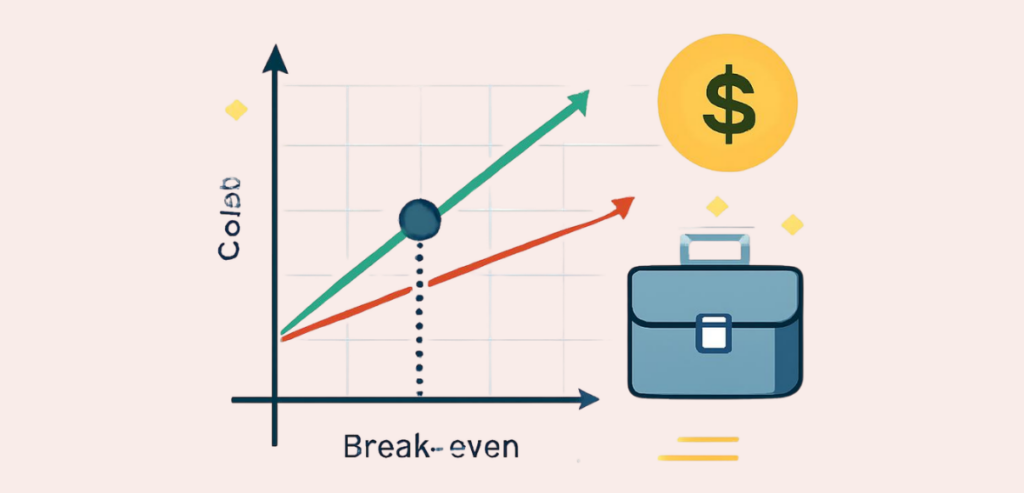
Break-even analysis typically identifies points in revenue and cost frameworks where total revenue equals total cost. Revenue at this equilibrium does not yield a profit, but does prevent a loss. Of course, selling beyond this equilibrium number of goods does yield profit, whereas selling less does result in a loss. That single point is referred to as the break-even point (BEP).
Break-even analysis is more of a planning and decision-making tool than strictly a bookkeeping measurement. It is not unusual for a potential investor or lender to request a break-even analysis before financing. It indicates precisely the revenue a business needs, at the very least, in order to avoid failure. Prior to venturing, pricing, or producing, (essentially) every new business should conduct this analysis.
Break-even analysis is important because it makes business decisions grounded in facts rather than emotion. Many first-time entrepreneurs set product prices based on instinct. A break-even analysis makes you detail every fixed and variable cost and decide on a price. Based on your break-even analysis, you know the minimum sales you need to achieve in order to make your business viable. It also helps set reasonable sales targets. Consider the size of your market, and if you find that your break-even sales goals are unreachable, it is a good stopping place before you use more capital.
The U.S. Small Business Administration says that one of the benefits of a break-even analysis is that it reduces the amount of emotion-based decisions you make regarding your business and helps prevent you from marketing and selling a product or service that is going to lose you money.
The importance of break-even analysis does not stop when a business is established. When a business is adding a new product, opening a new location, or hiring a new employee, it must use break-even analysis to assess the impact on fixed and variable costs and the break-even point.
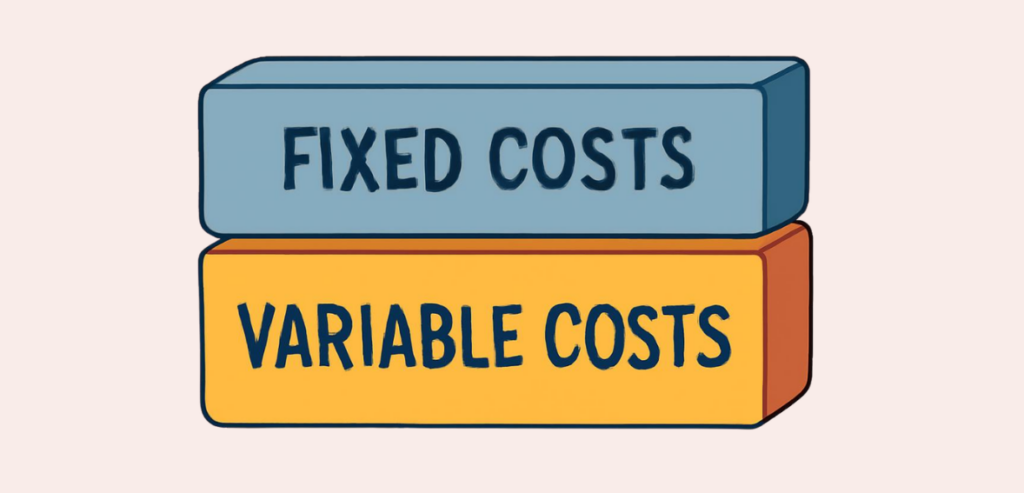
Understanding fixed and variable costs is essential when trying to find your break-even point.
While costs like rent, insurance, base salaries, loan payments, and most software subscriptions are fixed, they remain the same regardless of sales volume. Whether selling one unit or a thousand, the costs are the same.
Costs that change with sales volume, such as packaging, processing fees, and shipping, are variable costs. A sale can increase these costs, and a lack of sales can decrease the variable costs. Calculating your break-even point begins with understanding fixed and variable costs, and is followed by recognizing that the break-even point formula differentiates how each cost is treated.
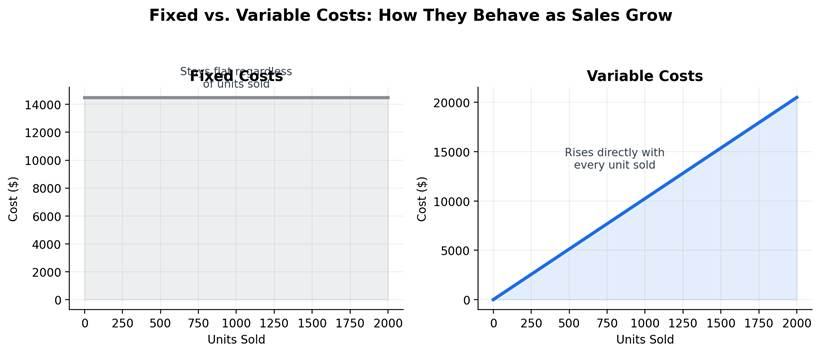
Fixed costs stay flat. Variable costs climb with every unit sold.
Most businesses have costs that are semi-variable, like the utilities. Utility bills have a base rate and a usage-based rate. For a clean break-even analysis, it’s best to separate these costs into fixed and variable components rather than lump them into a single category.
The value that makes the break-even analysis functional is the contribution margin. The contribution margin is the selling price reduced by the variable production cost. The remainder will go toward covering fixed costs. After fixed costs are covered, every contribution margin dollar earned is profit. The higher the contribution margin, the lower the break-even point, meaning that each sale covers more fixed costs. The higher the fixed costs are, the more contribution margin dollars are needed to make a profit. This explains why the contribution margin significantly influences pricing decisions and why the Corporate Finance Institute lists it as one of the five essentials of break-even analysis.
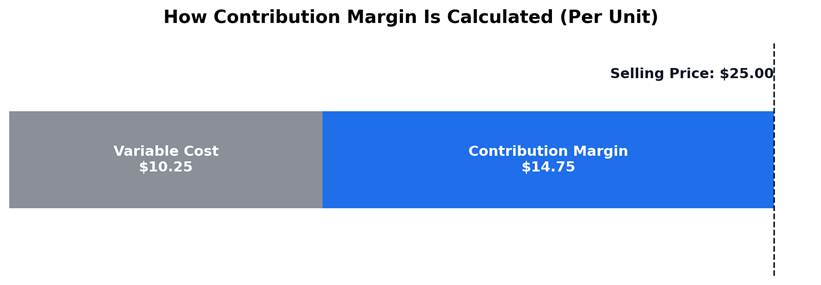
Selling price minus variable cost equals contribution margin.
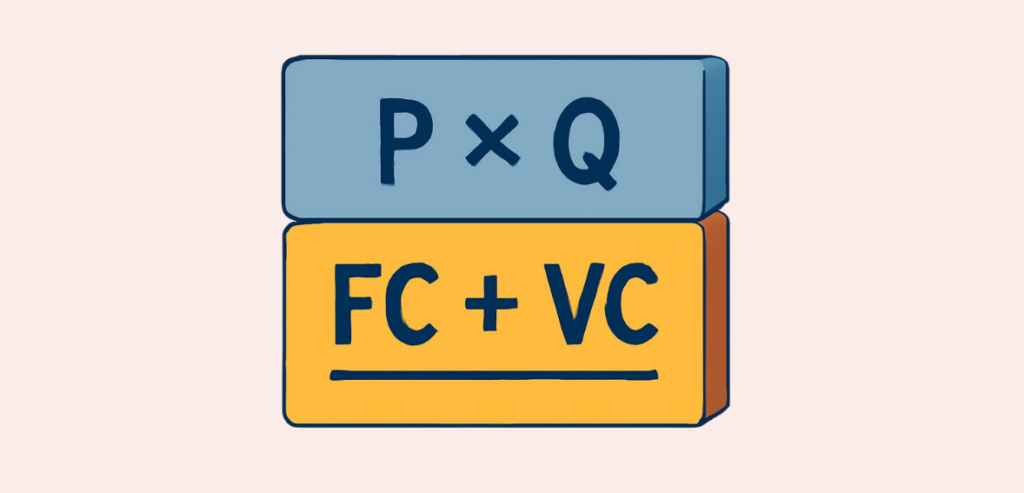
Calculating the break-even point is easy once you have your fixed and variable costs and your selling price. The formula for break-even point in units is:
Break-Even Point (units) = Fixed Costs ÷ (Price per Unit − Variable Cost per Unit)
The denominator here is your contribution margin. In dollars, the break-even point formula looks like this:
Break-Even Point (dollars) = Fixed Costs ÷ Contribution Margin Ratio
The percentage of the selling price that contributes to your margin is the contribution margin ratio. A break-even point formula will help you answer the same question in two different ways. One will tell you the number of units, and the other the amount of revenue.
To calculate break-even, you must first gather accurate figures. A break-even analysis relies on accurate cost data, so begin by listing all fixed monthly costs, such as rent, salaries, insurance, and loan payments. From there, create a total for your fixed costs. Next, determine your variable cost per unit. The variable costs include materials, direct labor for production, packaging, and any fees assessed on a per-unit basis.
The contribution margin is determined by subtracting your variable cost per unit from the selling price. Your total fixed cost divided by the contribution margin will provide you with your break-even point. To obtain a dollar value for the break-even point, simply multiply the break-even point in units by your selling price. Once you’ve done this, you can evaluate the break-even point against your sales capacity. If reaching the break-even point seems unlikely, you’ll want to assess your costs and your pricing (or both) before you proceed.
Business owners know that there will always be unanticipated costs. That is why many add a ten percent buffer or so to their fixed costs. With this buffer, unexpected costs will fall within the fixed costs, so this portion of the analysis won’t suffer.
You should use break-even in units to determine how many sales you need to make before you start earning a profit. This type of break-even analysis is most effective for businesses that sell one clearly defined, priced product. Examples of such businesses are candle makers or bakeries. Break-even in dollars shows you the total revenue needed to break even. This analysis type is more effective for businesses that sell many products priced differently, such as a retail business or a restaurant with a full menu. This is because tracking a “unit” in this case would be very difficult.
Neither of these is more correct than the other. It really depends on how your business sells. A lot of service-based businesses that bill by the hour use a break-even-in-dollars analysis and then convert it into billable hours.
Seeing how the break-even point formula is applied will make you more comfortable using the formula with your data.
GreenLeaf Candle Co. sells hand-poured candles at $25 each. Their monthly fixed costs are $14,500, and each candle costs $10.25 to make. Each candle thus contributes $14.75.
To find the break-even point, the contribution margin was divided by the total monthly fixed costs. This gave a break-even point of 984 candles. This tells us that GreenLeaf needs to sell at least that many candles to start covering costs. GreenLeaf’s monthly revenue at the break-even point is $24,600. Raising the price to $28 increases the contribution margin to $17.75 per candle, thus reducing the break-even point to 817 candles. Few things show the effect of pricing faster.
Numbers are helpful, but a break-even chart demonstrates a concept at a glance. A break-even chart plots total revenue and total cost against the number of units sold. The total revenue and total cost lines intersect at a single point. That point is called the break-even point. The loss zone, where total cost exceeds total revenue, is located below the break-even point. The profit zone, where total revenue exceeds total cost, is located above the break-even point.
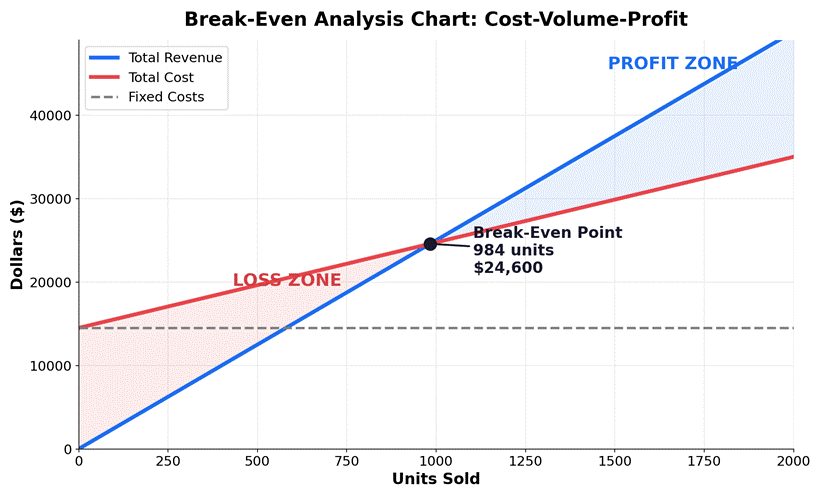
The break-even chart for GreenLeaf Candle Co., based on the example above.
These graphs, also known as cost-volume-profit graphs, are incredibly helpful to both investors and lenders, showing a business’s sensitivity to sales, prices, and costs. This is the exact reason that lenders request these graphs, along with a full business plan, as shown in NetSuite’s break-even analysis.
Break-even analysis considers much, but it cannot see all. One assumption the analysis makes is that costs stay neatly fixed or variable. In the real world, costs can be seasonal, or material costs can drop with bulk discounts. The analysis also assumes every sale is at a fixed price. This is unrealistic for companies that offer seasonal discounts, bundles, and other sales promotions.
Usually, companies can only analyze break-even points for a single product or a simple product lineup. Companies with products at different price points will need to revise the break-even analysis somewhat. With these assumptions and limitations in place, break-even analysis is a very practical and useful financial analysis for pricing strategies, especially with new companies.
The break-even point is the point at which total revenue equals total costs, and no profit or loss is made. By lowering your break-even point, you make profit easier to attain. There are only three ways to lower the break-even point. The first is raising the selling price. This method is the easiest and quickest way to lower the break-even point, since it instantly increases the contribution margin. The second method is lowering variable costs. This can be made possible by changing suppliers for better prices or cheaper packaging. The third method is to reduce fixed costs by renegotiating the rent, refinancing at a better rate, or eliminating subscriptions. Successful businesses implement a combination of all three methods over time.
Break-even analysis makes one of the more intimidating elements of running a business (making a profit) something you can address with basic math to answer. It enables you to calculate how many more sales or how much additional revenue is required to take your business from operating to profitable. It allows you to analyze and calculate this for any of your operational costs, costs associated with the marketing and delivery of your product or service, the margin associated with your product or service, and the pricing of your product and service after you understand the fixed and variable costs.
It also allows you to recalculate and reevaluate the break-even point for your product, service, or operational pricing whenever you adjust your pricing or associated costs, since the break-even point is one of the most variable aspects of running a business. It allows you to more easily adjust your pricing, improve your cash flow, and, most importantly, walk into meetings with potential investors with confidence and optimism.
There is no universally applicable number because a good break-even point is specific to your costs and your realistic sales capacity for your industry. A good rule of thumb is that your projected or current sales are comfortably above break-even sales, ideally twenty percent or more. The safety margin gives your business a cushion for a month with low sales or an unexpected increase in costs.
No. The break-even point is where total costs equal revenue. At that point, profit is zero. Profit starts when sales go beyond the break-even point. Many people conflate the two terms, but in a business’s financial life, they refer to two distinct stages.
Definitely. Service-based businesses can do break-even analyses with billable hours or client contracts/subscriptions. For example, a consultant can calculate the billable hours required each month, then determine the realistic weekly target by dividing the required hours by the hours available to work.
A business needs to adjust its break-even point after significant changes in costs or selling price, like when rent goes up or when they make a new hire or when the price from a supplier changes. Even in the absence of an immediate need, many businesses go over their break-even point on a quarterly basis to identify small, incremental cost changes that may lead to larger, costlier problems in the future.